UK Power Cut Map
Chapter 1: Four Websites on Every Call
I handle calls for an energy company. Let’s not get carried away — nobody’s life is saved by me, and nobody’s ever going to be genuinely rescued by anything I say on a call.
But there’s a specific question that comes up on a specific kind of call, and if you’ve ever taken one of those calls you know exactly which one I mean. You also know it hasn’t got a quick answer.
Someone’s reported a power cut. Lights are off. They want to know what’s happening, and more to the point they want to know whether it’s their fault.
That’s the question. Grid or property?
It ought to be simple. A street goes out, you look at the street, you find out who owns the supply.
Here’s the problem: “who owns the supply” isn’t one question with one answer in this country. Electricity distribution in Great Britain is split between six separate companies. Each of them publishes the answer on their own website. None of them publish it anywhere the others do.
So I look at one. Doesn’t cover their postcode — that one’s somebody else’s. So I look at another. That one covers it, but says nothing’s wrong, so it must belong to a third. Now I’m three tabs deep on a call, someone’s on hold, and I’m doing the thing where you say “bear with me” in a tone that communicates you are not entirely sure what you’re doing.
Now — I’m not having a go at the websites. Most of them are fine. Some of them are genuinely good.
The problem isn’t bad information. The problem is there’s nowhere to put it. Six companies, six websites, six login flows, and no single place that answers the question I actually got called about.
This should not need four websites.
That’s the whole thought. It arrived on a call, and it was not sophisticated.
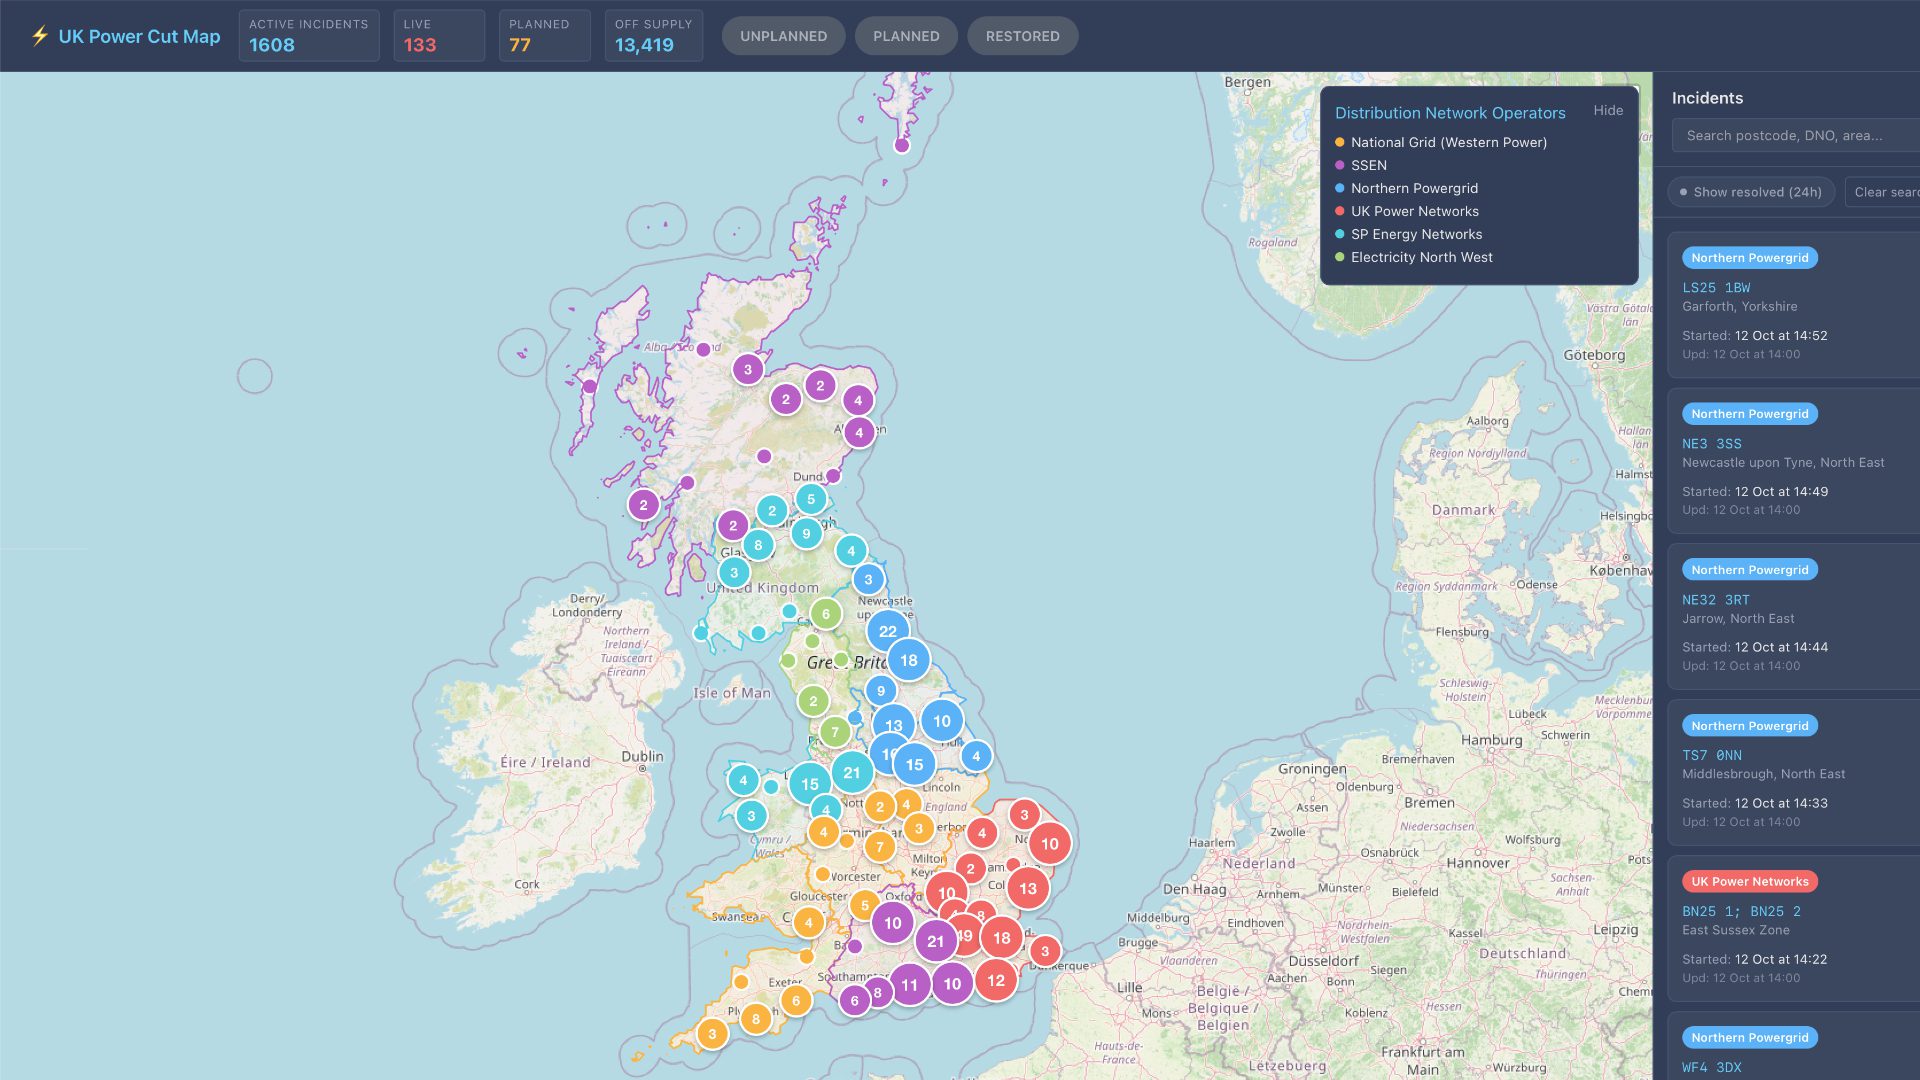
Anyway. What this post is about: I built a thing that pulls live power cut data from all six network operators onto one map. It’s running, you can look at it — pcut.jabi.uk. I didn’t invent a grid. Nobody at any of those companies owes me a favour for having done this. What I want to write down is how it actually got built, because the interesting parts weren’t the parts I expected.
One thing to clear up before we go any further: none of this is official. Nobody here knows about this post, nobody’s reviewed it, nobody’s approved it. It’s mine.
Now, the bit that sounds like a humblebrag and isn’t.
I’ve built a fair few other tools. Mostly for myself. Almost all of them started the same way — not “I had an idea”, more like: doing something repetitive at work, it was taking too long, and at some point I built the thing that did it instead. Energy cost and usage estimators. A savings tracker. A house deposit calculator. All small. None impressive. Every one exists because a five-minute irritation turned into a forty-hour build.
And one honest thing, so I can say it once and be done: I can’t give anybody a discount. It’s not an employee benefit, not a perk, and I won’t be saving anyone money with it. If you use it, you use it because it saves you time.
That’s genuinely all it is. It takes a bit of friction out of a job that’s already got plenty.
I could tell you about a specific call. There are a couple I’d quite like to, because they’d make this chapter a lot better.
I’m not going to.
Not because they’re uninteresting. Because they’re people’s electricity bills and people’s addresses, and I’d be describing somebody’s bad evening on the internet from inside a system that exists to stop me doing exactly that. The job comes with GDPR, it comes with professional confidentiality, and neither of them take a holiday because you’ve started writing a blog. So the best version of this chapter — the one with the actual call in it, in a bit of detail, funny and specific — is the one I’m not allowed to write.
Which is a bit of a shame, because I’ve gone back and forth on it a few times.
What I can say is what it’s like from the inside. You’re holding someone’s electricity problem in your head while you do the equivalent of four parallel searches. You know they’re waiting. They can hear you typing. And if you get it wrong, they go outside and check a neighbour’s house.
That last part’s the one that stays with me. The stakes aren’t abstract. If I tell someone their fault’s on the grid when it’s actually their consumer unit, I’ve sent a person out in the dark to look at a box in a cupboard, and they will not thank me for it.
For that specific mistake to be possible, in 2026, something’s wrong. Not evil-wrong. Silly-wrong. Six companies, one map, and a call centre.
And I can’t show you the thing that proves it, either. That’s the shape of the constraint, and the constraint is the point: the information that would make this a story is the same information the job tells me to protect, and it isn’t mine to spend.
Chapter 2: The Dashboard I Wanted
The second thing that made this happen isn’t about work. It’s about what I do when I’m not working, and I should say up front that this part of the post is pure self-indulgence.
I’ve spent a lot of time looking at other people’s dashboards. If you haven’t seen them, there’s a genre out there that tracks conflict zones — casualties, incidents, strikes, all of it, live, updated constantly, and properly impressive to look at. I’ve spent real time on those and found them interesting.
Then the honest question turns up, and it’s this: why would I want that on my wall?
Because what I actually want isn’t a geopolitical picture. What I want is the thing that’d be useful to somebody who isn’t thinking about the world.
The weather. What’s happening near me. When the bins go out. Whether the train’s running.
That’s the actual content of a hallway screen. Something you glance at on the way past. Not a dashboard you sit down and study. A glance. Is it cold. Is the light on out there. When does the truck come.
I can’t buy that, and I’ve stopped looking, because the thing I want doesn’t exist as a product. It exists as six or seven separate apps that each do one part of it and none of them agree with each other.
Which brings me back to the call.
Because the power cut map is first in that queue for a reason that’s entirely about this project rather than general enthusiasm. The data source that made my job hard was the same data source that made the map possible. Those four websites I was opening on a call were four unopened doors.
That’s the collision, and it’s why this thing exists instead of being one of several. If the frustration had been about the weather, I’d still be looking. It was about power cuts specifically, and power cuts happened to have a public data feed.
There is a dashboard for all this. It’s called Glass. It’s something I’m working on, when I get to it, and it isn’t finished. I’m not going to say otherwise, and I’m not going into detail, because I honestly don’t know how far I’ve got with it, and I’d rather be vague and right than specific and wrong.
What I will say is that the shape of it is decided. One gateway, one database, every map reads from that. And that isn’t an aspiration that arrived from nowhere — it’s what the code already does for one map. I very nearly didn’t end up with it, and there’s a reason for that which I’ll come back to when we get there.
There’s also a word on the parts that aren’t built, because a plan like this is mostly unfinished things and saying otherwise would be silly. I have weather and transport maps from an earlier phase that I’m not counting. They work. They were built a different way, I’ve since changed my mind about that way, and I’ll explain why near the end.
So the hallway screen is ambition, not a product announcement. The power cut map is the real one, and the one I can show you. The rest is a queue.
Chapter 3: Six Companies, Six Answers
Before any of this makes sense, you need the shape of the thing you’re trying to read from, and the shape is: six companies, three countries, one island that’s mostly one company at a time.
Great Britain’s electricity distribution — the bit that takes power off the high-voltage national grid and actually drops it into the streets — is split between six licensed operators. Each one holds a monopoly in its own patch. Not a shared market with six players in it. Six separate monopolies, side by side, with no overlap and no requirement to talk to each other.
The six don’t split the country into six pieces, though. They split it into fourteen, because several of them run separate licence areas, and those areas are where things stop being tidy.
Electricity North West — one area, and it’s the obvious one. North West England. Lancashire, Cumbria, Greater Manchester, Cheshire.
Northern Powergrid — two: North East England, and Yorkshire.
UK Power Networks — three: London, the South East, and East England. The busiest corner of the country, and one of the six, which is worth remembering next time somebody tells you the grid is archaic.
SP Energy Networks — two: South and Central Scotland, and North Wales, Merseyside and Cheshire.
SSEN — two, and this is the one that catches people out. North Scotland, and Southern England. The second one isn’t the bottom of the map, mind — UK Power Networks holds the South East — it’s the middle of the south: Hampshire, the Isle of Wight, Dorset, Wiltshire, the Thames valley west of London. And you’ll notice what that means for Scotland: north is SSEN, south and central is SP. Scotland isn’t one company’s patch, it’s two of them, divided somewhere in the Highlands.
National Grid Electricity Distribution — four, the most of anyone. East Midlands, West Midlands, South Wales, South West England.
Which means Wales is split the same way Scotland is: north is SP, south is National Grid. The map on my wall has two seam lines running through it, one at roughly the Highland line and one up the middle of Wales, and neither of them have anything to do with geography. They’re where a piece of paper ran out.
And Northern Ireland, which has its own arrangement entirely and isn’t on this map at all. The system over there is a different beast, and I’d rather say that than claim I’ve covered the whole island.
One naming thing while we’re here, because it’ll save you confusion if you go looking: the code calls the last one “National Grid (Western Power)”. It’s the same company — Western Power Distribution became National Grid Electricity Distribution a while back, and the scraper config has never been renamed to match. The old name stuck in one place and the new one is on the website you’re meant to click.
Fourteen areas, six companies. That’s the whole structure. It’s smaller than you’d think, and the reason your call takes four websites is sitting right there in it — not a technical limitation, not a hard problem. A piece of paperwork.
What a record looks like
So I need to read six feeds and present them as one. Before I can do that I need to know what I’m reading.
Pull up any of these feeds and you get a list. Each entry is a power cut, and each one has roughly the same job to do, which is: say where, say how big, say when.
Concretely, a record carries a reference number — the operator’s own ID for this incident, and the only thing that’s stable about it. A postcode, or several. Coordinates. A status. A count of customers affected. An estimated restoration time. A start time. A description, in the operator’s own words.
That’s it. Nine fields doing all the work.
The one that tells you scale is customers affected. And this is where it starts getting interesting, because two of the six do something different with it.
Northern Powergrid gives you two numbers: totalconfirmedpowercut and totalpredictedpowercut. Confirmed and predicted, in the same record, which is honest of them — they’re telling you how much of this is an engineer standing in a substation versus a model guessing from load. UK Power Networks gives you nocustomeraffected, which reads like it’s saying nothing, and is in fact “number of customer affected”, just concatenated in the way that Opendatasoft fields tend to be.
And SP Energy Networks gives you nothing. Not an empty string, not a zero. The parser hardcodes customersAffected: null for every single SP record, because the feed doesn’t carry the field.
So on a map where the size of a marker means the size of the outage, every incident in South and Central Scotland, and in North Wales, comes out the same size. Not because those outages are the same size. Because one company doesn’t publish the number.
I could have left them blank and moved on. I could have guessed from the incident’s geographic spread, which is what the postcode tells you and is roughly what a lot of dashboards do. I didn’t, because a marker that’s the wrong size is worse than one that’s the right shape and honestly missing information. The map shows what it knows. It doesn’t fill in the gaps with something that looks like knowledge.
That decision comes back later, when I get to what happens when you build on six people’s data instead of one person’s data. Because that’s the first one.
The least reliable field
Then there’s estimated restoration time.
Every feed has it. Every feed publishes it in good faith. It is, without exception, the least reliable field in the dataset, and I don’t think that’s anybody’s fault.
It’s an estimate. That’s the name of it. And it’s an estimate made under the worst possible conditions for an estimate — you’ve got engineers who haven’t reached the fault yet, no confirmation of what’s failed, weather potentially still happening, and a queue of other incidents ahead of you. So the number comes out, and it moves, and then it moves again.
Sometimes it moves to a time that’s already gone.
And the problem with an estimate that’s published in a field called “estimated restoration time” is that it looks like a promise. It’s a timestamp. It’s got a date and an hour on it. It sits in a table in the same row as the postcode, which is a fact. So you read it as one.
What it actually is: somebody’s first guess at what happens next, published in the same weight of type as everything else.
The map shows it because not showing it would be worse — people do plan around these, and if there’s an ETA you should see it. I just don’t want to imply it’s a commitment, and I’d encourage anyone reading an ETA off any power cut dashboard, mine included, to treat it as a directional thing until an engineer is standing next to the box.
Why nobody built this already
And now you’ve seen the shape of it, so let me say the thing I’ve been building towards.
There is no single authority here. Not “there isn’t one yet”. There is no body whose job it is to hold the definitive answer, because the licensing arrangement that created six monopolies didn’t come with anyone sitting above them with a merged view.
So on a power cut call — back to where this started — when a customer wants to know whether it’s their house or the street, I’m not querying an authoritative source and getting an answer. I’m trying six companies’ separate opinions about who owns the bit of wire outside their house, and hoping they agree, and working out who to believe when they don’t.
That’s the same problem in a job, wearing a phone.
And it explains something about the tool that I think is worth naming now rather than claiming I worked it out later. The map can’t be “the answer” either. It’s six feeds, stitched, and when they contradict each other it shows you six feeds contradicting each other. What it does is remove the part of the job that’s just finding the things, which is the part that was eating the call. The judgement stays mine.
Which is, when you think about it, exactly what I wanted from it.
Chapter 4: Finding the Endpoints
So: six companies, fourteen licence areas, and no idea where any of them keep the answer.
That’s where this started. Not with a design. With six websites and a question about whether any of them had an API — in the sense of an actual endpoint I could point something at, rather than a page I’d have to scrape.
Four of them do, in the sense you’d hope. Two of them do it in a sense I did not expect.
The one that was straightforward
UK Power Networks publishes theirs properly. There’s a documented open data portal, there’s an API key you can generate, there’s a schema you can read before you make a single request, and it tells you what every field is called.
That’s the whole thing. It worked first time, and that deserves saying plainly, because everything else in this chapter is defined by contrast with it — this is what it looks like when someone has actually thought about being a data provider.
Then I found the other three, and the penny dropped
SP Energy Networks, Electricity North West and Northern Powergrid all have portals too. All with API keys. All with schemas.
All on the same platform.
Opendatasoft. A French open-data platform. All four of them — UK Power Networks, SP Energy, Electricity North West, Northern Powergrid — independently ended up on it, all using the same version of the same records API:
/api/explore/v2.1/catalog/datasets/...
Different datasets, different keys, different everything else. Same API.
And that is the single most useful fact in the entire project. Because it means that once you have one working, you nearly have four. The auth model is the same. The pagination is the same. The where and orderBy and limitparameters behave identically. You write the request builder once and you’re three-quarters done.
That’s where the UK Power Networks win ended, though, because sharing a platform doesn’t mean sharing a shape. Same API, same parameters, same pagination — and underneath it, six completely different ideas about what a power cut record is. I’ll get to that next.
For now the more important thing: four of six, one platform, and then two that aren’t.
The two that aren’t
National Grid’s endpoint is:
powercuts.nationalgrid.co.uk/__powercuts/getTabularView
Look at that name. getTabularView. That is not somebody designing a public API. That is somebody building a web page that needs its table populated, and the endpoint exists as a consequence of the table existing.
SSEN’s is:
external.distribution.prd.ssen.co.uk/opendataportal-prd/v4/api/getallfaults
This one at least looks like an API — v4, api, getallfaults. And it behaves like one. It’s just built by a different team with different instincts, on a different path, with a different idea of what a fault record is.
Two bespoke endpoints, two completely different vocabularies, and neither of them sharing a line of code with anything else. If I’d been hoping that six companies would mean six implementations of one standard, this is where that hope went.
I’ll be straight with you about something else, because it matters more than it sounds: I didn’t get these from a documentation page. There isn’t a “here is our public power cuts API” page for either of them in the sense you’d want. You find these by working out what the operator’s own website is asking for when it loads its own fault list, and then you go and ask for that yourself.
Which is a perfectly normal thing to do — and it’s why these two belong in a different category from the Opendatasoft four. The four are offered. These two are observed.
That distinction turns out to matter more than it sounds like it should.
The part that actually took the time
Right. Six endpoints, six responses. Time to write six parsers.
And this is where I have to admit that finding the endpoints was maybe a fifth of the work, and I’d have guessed the opposite going in.
Here’s the problem, and I’m going to show you the shape of it rather than describe it abstractly, because you can see it in one line each.
Where is the latitude?
// National Grid
lat: item.latitude || item.lat

// SSEN
lat: item.location?.latitude

// SP Energy Networks
lat: item.location_latitude

// UK Power Networks
lat: item.geopoint.lat

// Electricity North West
lat: item.geo_point_2d.lat

// Northern Powergrid
lat: item.lat || item.geopoint?.lat || item.geo_point_2d?.lat
Same field. Same thing. Six ways of writing it, because six teams solved the same problem six times without ever seeing each other’s work.
And every one of those || in there is there for a reason — it’s there because at some point a record came back and the field I was reading was null, and the map had a marker in the wrong place, or no marker at all, and I went back and found out that some subset of that operator’s records use a different name.
That’s the real shape of the work. Not discovery. Correction. Every single fallback in every one of those parsers is a bug I found in production and then wrote down.
It’s the same story with the field names for everything else. Here’s when each incident started:
| Operator | Field |
|---|---|
| National Grid | startTime |
| SSEN | loggedAtUtc |
| SP Energy | date_of_reported_fault |
| UK Power Networks | creationdatetime |
| Electricity North West | outage_time |
| Northern Powergrid | loggedtime |
Six fields. Camel case, snake case, Pascal case, and one that’s just all the words run together. Somebody somewhere named a field date_of_reported_fault and somebody else looked at it and typed creationdatetime, and now there’s a table in my database holding both.
And here’s estimated restoration, which we established last chapter is the least reliable thing in the dataset:
| Operator | Field |
|---|---|
| National Grid | etr |
| SSEN | estimatedRestorationTimeUtc |
| SP Energy | etr |
| UK Power Networks | estimatedrestorationdate |
| Electricity North West | estimated_restoration_time |
| Northern Powergrid | estimatedtimetillresolution |
Three letters. A fully hyphenated sentence in camel case. The same word with date bolted onto the end when it isn’t a date. And estimatedtimetillresolution, which is just the phrase typed out in the hope the computer wouldn’t mind.
I could do this for all nine fields. The reference numbers are id, reference, fault_id, incidentreference, incident_num — five different names across six operators, and two of them are both called reference and mean different things in different records.
This is the actual craft of the project. Not the map, not the design, not the deployment. It’s six people’s naming conventions in one function.
Then the statuses, which is worse
And then there’s status, which is where it stops being a naming inconvenience and becomes a genuine design problem.
Because the six of them don’t just disagree on what to call a status. They disagree on what a status is.
Three of them use words. National Grid, SP Energy and Electricity North West all hand you something like restored, or unplanned, or in progress — human-readable text, free-form, and you lower-case it and put an underscore in it and you’re done.
UK Power Networks uses numbers:
1: 'awaiting_allocation'
2: 'en_route'
3: 'on_site'
4: 'restored'
5: 'planned'
6: 'closed'
Northern Powergrid also uses numbers, but a completely different set of them:
1: 'response_not_started'
2: 'fault_logged'
3: 'dispatching'
4: 'engineers_en_route'
5: 'on_site_investigation'
6: 'restoration_in_progress'
7: 'validation_checks'
8: 'fully_resolved'
Eight stages. From response_not_started all the way to fully_resolved, and Northern Powergrid has clearly thought about this in some detail — there’s a validation stage in there before they’ll call it finished, which is a genuinely nice piece of operational care.
And SSEN uses letters:
'R'  → 'restored'
'FI' → 'fixed'
'I'  → 'in_progress'
'IN' → 'in_progress'
'OR' → 'ordered'
''   → 'unplanned'
Two-letter codes, no documentation of what the full set is, and a blank string that means “we don’t know yet” — which is arguably the most honest entry in the whole dataset.
Six operators, three status systems. Words, numbers, letters. And no list anywhere that tells you what all of them mean.
That’s not a difficulty you can design your way around by being clever. It’s just six people who’ve never met.
And that lands exactly where we left it last chapter — six monopolies, no shared authority, nobody sitting above them with a merged view. I’d assumed the data would be the easy part and the map would be the hard part. It’s the other way round, and it’s the other way round by a distance.
Chapter 5: Six APIs, Four Shapes
Six endpoints responding. Six different ideas of what a power cut is.
This is the chapter where that stops being interesting and starts being work, because everything downstream — the map, the search, the postcode lookup, the very idea of a marker on a screen — needs one shape to come out the other end.
Three names for the same list
First question when a response lands: where’s the list?
// National Grid
data.incidents

// SSEN
data.faults

// SP Energy, UK Power Networks, Electricity North West, Northern Powergrid
data.results
Three names. And the split is exactly the split from last chapter: the four Opendatasoft operators all return results, because that’s what Opendatasoft returns, and the two bespoke ones each picked a different word.
So the Opendatasoft bet paid off twice. Same request shape, same response shape. Once you’ve written data.resultsyou’ve written it four times.
incidents is the honest one. SSEN’s faults is arguably more accurate than incidents, because a fault is the thing that actually happened out in a field and an incident is the record of it — SSEN are telling you about the physical event, the rest are telling you about the paperwork.
results is what you call something when you’re returning a query and nobody’s stopped to ask what it means.
The denylist, which is the real decision
Now: which of these are over?
Because the feed doesn’t come labelled “this one’s finished”. It comes with a status field — a word, a number, a letter, depending who you’re asking — and by the time it reaches me the parser has already turned it into a word of that operator’s choosing. So I need a list of words that mean “this power cut has ended”.
Here’s the list:
restored, resolved, completed, fixed, closed, fully_resolved
Six words. Six operators. All meaning the same thing.
And it matters that this is a denylist — anything not on it counts as active — rather than an allowlist of words I recognise as ongoing.
That choice is the whole design, so here’s why.
An allowlist would be safe. I’d recognise unplanned, in_progress, engineers_en_route, and everything else would be treated as finished. Nothing would ever be stuck open on my map. That’s the comfortable option and it’s the wrong one, because the cost lands in the wrong place: if an operator introduces a status I’ve never seen, my map closes an outage that is still happening. Someone in a dark street looks at a map that says everything’s fine.
With a denylist the failure is the opposite way round. An unknown status stays open. The map shows a power cut that might already be resolved. It’s wrong, it’s visible, and nobody’s getting sent outside in the rain on the strength of it.
And when I don’t know what a status means, I assume it’s still on.
That’s not clever. It’s a decision about which kind of mistake to make, and I’d rather be wrong in the direction of caution about electricity.
The list is in the code six times
And now the bit I’m less pleased about.
That list — those six words — is not defined in one place. It’s typed out, verbatim, in every query that needs it. The active-incident query. The resolved query. The health endpoint. The postcode search. The status-change detector. Each one carries its own copy of restored, resolved, completed, fixed, closed, fully_resolved.
It’s already drifted. One of them — searchByPostcode in services/incidents.ts — has only two words in it: restored, resolved. The other four aren’t there.
That function is imported at the top of index.ts and then never called. The live postcode route wrote its own query, with all six words in it, and nobody went back to delete the other one. So today it doesn’t bite — nothing reads it, and if you searched a postcode for a closed incident you’d get the right answer from the query that actually runs.
That’s a bit of luck rather than a design, and which of the two it is matters. The list is written out in six places. One of those copies is already wrong. It happens to be the copy nobody calls. The next person to add a query will copy whichever one they land on first, and if they land on searchByPostcode they’ll ship the wrong behaviour on day one — not because they made a mistake, but because the code gave them a stale example to follow.
It’s a two-line fix — one constant, referenced from every query — and it isn’t done.
Up, not append
One more structural decision, and it’s a small one that pays for itself.
Every incident is upserted, not appended. The database key is the operator’s reference number, so when the same incident comes back on the next scrape — every ten minutes, forever — it updates the row it already has rather than adding another.
ON CONFLICT (reference) DO UPDATE SET
  status = EXCLUDED.status,
  customers_affected = EXCLUDED.customers_affected,
  est_restoration = EXCLUDED.est_restoration,
  description = EXCLUDED.description,
  raw_data = EXCLUDED.raw_data,
A power cut that runs for six hours produces one row, not thirty-six. And the row gets better over time — the customers-affected count climbs, the estimate moves, the description gets rewritten by whoever’s now standing in the substation.
What it doesn’t touch: the location, the postcode, the severity, the start time. Those are written once and then frozen. Which is deliberate, because if an operator’s first pass at a coordinate is off and they correct it, I’d rather keep the original position than have markers sliding around the map on their second guess.
Fair enough. Arguably the opposite is right. Both of those are defensible and it doesn’t keep me up at night.
The same incident, twice
And then dedupe, which is where the “choosing the richer record” decision lives.
Sometimes the same incident arrives twice — two references pointing at the same real-world outage, with different levels of detail. One might say thirty customers, the other might say a hundred and twenty, because an engineer got on site and counted.
if (!seen.has(key)) seen.set(key, item);
else if (item.customersAffected > seen.get(key).customersAffected)
  seen.set(key, item);
So: keep the one with the bigger number.
Not the newer one. Not the first one. The one that knows more.
The reasoning is simple — if two records describe the same outage and one of them has been told how many people are affected, that one is closer to true, and I’d rather show the truth than show the first thing I saw.
And it falls back to coordinates when there’s no reference at all, so an incident with no ID at all at least gets grouped by where it is rather than showing up as five separate markers on the same street.
Which is not, in the end, very clever
None of this is hard, and the last chapter made it sound like I was wrestling with six incompatible systems. This one is a list of six words and a handful of ||s.
The whole normalisation is: pick the right list out of the response, lower-case it, map it through a small table, join the postcodes with semicolons, and write it to a row that probably already exists.
There are no algorithms in this project. Nothing sorts. Nothing optimises. The most interesting decision I’ve made in this chapter is which direction to be wrong in.
But that’s the actual job. The job isn’t cleverness, it’s agreeing to a single definition of “a power cut” when six companies have already given you six of them — and then being consistent about it, in one place, so that the map and the search and the postcode lookup all have the same opinion.
Six companies, four shapes, one list of six words — typed out six times over, when it should be typed out once.
Chapter 6: Staying Inside the Limits
Before I go anywhere near the six DNO APIs, I need to tell you where the habit came from, because it isn’t technical and it happened first.
I use the free tiers of ChatGPT, Gemini and Opencode’s Big Pickle. You know the score. You get going on something, you’re three exchanges deep, the idea is arriving properly for the first time, and then you hit the wall. Out of messages. Come back in however long.
By the time it’s back, the idea’s gone. Not delayed — gone. I’ve tried to pick it up and there’s nothing there. It was a shape in my head for about forty seconds and the wall turned up in the middle of it.
That’s happened enough times that it’s stopped being annoying and turned into an instinct. Now, the moment I see a published limit on anything, I do the same arithmetic. How many calls is that per day. Per month. Per year, if the limit’s annual. Divide it out, see what the number actually is, and then find out whether the thing I want to build fits inside it — before I write a single line.
So by the time I got to six power cut APIs, I’d already done the maths. And it was the first thing I did, before the map, before the parsers, before I knew what the payloads looked like.
That’s what this chapter is about. Not cleverness about rate limits. Just doing the division early enough that it still changes what you build.
The database is the whole design
Here’s the bit I’d point at if somebody asked me how the thing works.
The gateway is the only thing that ever talks to a DNO.
That’s it. That’s the architecture. Everything else — the map, the search, the postcode lookup, the thing you’ve got open in a tab — reads from a database, and the database was filled in by a process that runs every ten minutes.
Which means your refresh doesn’t touch a DNO. Neither does mine. Neither does the next person’s. The map can be open on forty screens and every one of them is being served by the same ten-minute-old copy. The six companies see exactly one request every ten minutes and they’d never know anybody was looking.
I like this design more than I probably should, because it’s not novel. It’s a cache in front of a database. But it does something specific that a cleverer design wouldn’t: it takes the rate limit off the critical path entirely. There’s no scenario where a viewer’s click is the thing that gets me blocked, because a viewer’s click never reaches them.
Ten minutes
The scrape runs on a ten-minute cron:
powerCuts: { interval: '*/10 * * * *' },
Why not every minute? Six requests every minute is 1,440 a day. Six requests every ten minutes is 864. Both are technically fine, and that’s the point — I’m not choosing based on what I can get away with. I’m choosing to be unremarkable.
There’s a version of this where the cron fires every minute because a power cut is urgent and ten minutes feels slow. And that would work for months, right up until the day it doesn’t, and I’d find out by being blocked rather than by anyone telling me.
A limit you’re sitting right underneath is a limit you’re one bad afternoon from crossing. So the number goes where nobody has to think about it.
The honest version of why ten minutes: I don’t mind waiting. If a street goes dark and the map’s ten minutes behind, nobody dies of that. The person in Chapter 1 who wants to know whether it’s their house is finding out from me or from four websites, and ten minutes stale is still a sight better than four tabs.
The 2,855-row table
This is my favourite decision in the whole project, and it’s a rate-limit decision wearing a feature costume.
When an incident comes in with a postcode, I need town, area and coordinates. The obvious way to do that is to ask somebody. api.postcodes.io will give you a postcode’s coordinates. findthatpostcode.uk will give you the areas around a point. Both are good services. Both are free. Both have a limit.
I don’t call either of them.
Instead there’s a table — 2,855 outward codes, town, area, lat, lon, generated once into a file that sits in the bundle:
"YO8": { town: "Selby", area: "North Yorkshire", lat: 53.78, lon: -1.06 },
Look up a postcode in there and you’ve got everything, instantly, and the cost was zero — not zero pounds, zero requests.
And when an incident has coordinates but no postcode — which happens, because not every operator gives you one — it works backwards: nearest outward code in the table, and the UI marks it (approx).
That parenthetical is the bit I’d defend hardest. It’s a rate-limit decision leaking into the interface. Rather than make a geocoding call to get a precise answer, I find the nearest thing I already know and I tell you it’s approximate. The map stays free of API calls and the reader isn’t misled about how good the number is.
There’s a cost, and I should say what it is. The postcode table came from a generated HTML file, so it’s only as good as whatever produced it. If Royal Mail adds an outward code tomorrow, it’s not in there until I regenerate. And findNearestOutwardCode is doing distance maths across 2,855 rows to place one marker, which is the least elegant thing in the codebase and also runs in under a millisecond, so it stays.
There’s a version in the repo where I did call those APIs. geocode.ts — a reverse geocoder that hits findthatpostcode.uk for the areas around a point, and api.postcodes.io for coordinates. Written properly, with timeouts and error handling, doing exactly the thing I’ve just spent two thousand words saying I don’t do.
It doesn’t get called. Nothing imports it. It sat there, working, while I built the table instead.
I left it, which I think is right — it’s the record of changing my mind, and deleting it would have made the repo tidier and my reasoning less visible. But it does mean the codebase now contains a perfectly good API client that the design has decided against, and if you ever read geocode.ts and think “why isn’t this used?”, that’s why. I used it, then I didn’t.
Two timeouts
There are two timeouts in this system and they are deliberately different.
The scraper waits 30 seconds for a DNO. The frontend waits 10 seconds for the gateway.
That looks inconsistent until you think about where each one sits. The scraper is on a cron. If Northern Powergrid’s pagination takes twenty seconds to work through — and it does, there are 700-odd records and it fetches them a hundred at a time — a short timeout would mean losing that operator’s data every single time while everything else succeeded. The scrape runs every ten minutes. It has a spare nine and a half.
The frontend timeout is short on purpose. If the gateway hasn’t answered in ten seconds, the page’s cache still has something in it. Showing a slightly old map is fine. Sitting there with a spinner while a backend struggles is not. So the frontend gives up early and serves what it has.
That’s the whole trick with timeouts: the number should match how long you can afford to keep someone waiting, not how long the request might take.
What happens when a source ignores me
Now the part of this chapter that isn’t a success story.
There is no exponential backoff. There is no retry logic for DNO sources. If a scrape fails, it logs the error and moves to the next operator:
} catch (err) {
  console.error(`[${dno}] Scrape failed:`, err.message);
}
That’s it. Six operators in a loop, each one in its own try, each failure logged and walked past. National Grid can be down for an hour and the map will show the other five and a slightly staler picture, and nothing retries.
The one place retries do exist is the database, and that’s a different problem — db.ts will try five times with a two-second gap to create the schema at boot, because a database that isn’t ready yet is a database that’s about to be ready. A DNO that’s refused you is a different situation, and retrying immediately is how you turn a polite request into the thing that got you noticed.
That isn’t a considered position I arrived at deliberately. The catch block is there because the loop needed one. The design happens to be right — one pass, log it, carry on, fill in the gap next time — but if you told me I’d planned it I’d be lying.
So where’s the arithmetic
Back to the thing that started the chapter.
864 requests a day to the six of them. Six at a time, once every ten minutes, no retries, no backoff, no burst, and a database in front so that nobody’s curiosity can turn into a request.
None of that would have happened if I’d built the map first and thought about limits afterwards. The cache wouldn’t exist as the default — it’d be an optimisation added later, once somebody noticed. The geocoding would be calls to a public API, one per incident, right up until the day a busy storm made it a hundred calls in a minute. The cron would be “every minute, because why not.”
All of those are the natural way to build it. All of them cross a line you can’t see until you’re over it.
So: read the limit, do the division, find out what fits, and build the thing that fits. Not because you’re frightened of getting blocked, but because the alternative is finding out you were too close by being told.
Chapter 7: What I Built It For
Before the purpose, the plumbing, because the two turn out to be the same thing and the way it runs tells you what kind of object this is.
It’s three containers on a small VPS. Postgres, the gateway, the map. Two images built here, pushed up, pulled down there. The whole deployment is a script that pulls the images, tears the old ones down, brings the new ones up, waits ten seconds and then asks each of them whether they’re awake:
docker exec data-gateway wget --spider -q http://localhost:4000/health
docker exec dno-map     wget --spider -q http://localhost:3000/api/incidents
Two green ticks and a printed address. That’s a release.
I like how unremarkable it is. There’s no orchestration, no rolling anything, no cleverness — the gateway is down for a few seconds while it restarts and the map carries on serving whatever it last had, which is the entire reason for having a database in front in the first place. The thing I built in Chapter 6 gets exercised every single deploy without anyone arranging it.
What the ticks don’t check
Both healthchecks are asking “are you listening”, not “are you working”. The gateway will cheerfully return 200 OKwith a body saying there are zero incidents in the database, and deploy.sh will call that a pass, because all it did was confirm a socket opened.
That matters more than you’d think on a fresh box, because nothing scrapes on boot. The gateway starts, creates the schema, opens a port, and then waits. The first scrape is the next multiple of ten minutes, and until it arrives the database holds whatever it held before — nothing at all on the first ever run.
So a brand-new server can be fully healthy, every tick green, and looking at an empty map for up to ten minutes. “Healthy” and “working” are two different questions, and the script I wrote only asks the first one.
Two things the map knows and doesn’t say
While we’re on the subject of signals that exist and go nowhere.
When the gateway fetch fails and there’s older data in the cache, getIncidents() hands back a flag:
return { incidents: cache.incidents, stale: true, timestamp: cache.lastFetch! };
stale: true. It travels all the way out of the server, through /api/incidents, into the response body — and then nothing picks it up. Not one component reads it. The map will happily show you a two-hour-old picture of six companies’ power cuts with no indication whatsoever that the last twenty scrapes didn’t land.
Errors, on the other hand, do get shown. error goes into the list component and you’ll see it. So the app distinguishes between “I couldn’t get any data” and “I’m showing you old data”, carries both upstairs, and only puts one of them on the screen — and it’s put the wrong one. Failing loudly is easy. Being honest about being quiet is the part I didn’t do.
The other one’s smaller. Bottom-left of the map there’s a version number, v2026-09-01-next, sitting at about sixty percent opacity where a version number belongs. It’s a constant. The hook has a version state and a setVersion in it that has never been called, so version || VERSION always resolves to the constant. It has said the same thing since the first of September and it will say it forever.
Which, honestly, is a fair label for the build. But if you were hoping the corner of the map would tell you which one you were looking at, it won’t.
What’s actually on the screen
Enough of the wiring. Here’s what you get when you open it.
A map. Markers, sized by how many people are affected and coloured by what kind of status that operator gave it — the same statuses from Chapter 4, now with a legend that translates them. Click one and you get the reference number, the postcode or postcodes, the operator’s own description, the estimated restoration, and a link to that company’s own page about it.
Underneath the markers there are the boundaries. The fourteen licence areas from Chapter 3, drawn straight off the GeoJSON — one polygon each, tinted by whoever holds it, six colours over fourteen patches. Zoom out to the whole country and the two seam lines I described as paperwork are sitting there on the screen: SSEN’s purple across the north of Scotland with SP’s below it, the same split running through Wales, and National Grid’s orange turning up in the Midlands, Wales and the South West as though it were three companies instead of one.
They’re drawn so you can look at them and not click them, which was deliberate and took one line. A boundary that answers a click is a boundary promising something about what it can tell you, and all mine can tell you is whose patch it is.
On a busy night the markers don’t pile up on each other either — they clump into a numbered circle you can click to break apart. Not clever, but it’s the difference between a map and a smear of overlapping pins.
Filters down one side: by operator, by text, by active or planned. A postcode search that draws a radius around wherever you typed and shows what’s inside it, worked out with a haversine on the client because it’s one trig sum and not worth a round trip. A list beside the map for people who’d rather read than look. And a count across the top — total, live, planned, customers affected — which is the number I’d have killed for on a call.
The search deserves one honest note, because it’s the first thing anyone will try. Type a full postcode and you’ll get your outward district — every incident in it — rather than your street. That isn’t the search being lazy, it’s the resolution the data actually supports. These feeds hand you postcodes as outward codes, sometimes several of them semicolon-joined into one field, and some records carry an area instead of an address at all. Faking street-level precision would mean inventing it.
It also needs somewhere to stand the radius, and that comes out of the same 2,855-row table as everything else. If the lookup came back empty it would draw the circle around a fixed point in the middle of the country instead, which you’d notice. It’s there because a search that’s odd beats a search that throws — the same argument as the denylist, wearing a search box.
The customers-affected total is where Chapter 3 comes back to bite. SP Energy’s records are null, so the sum is simply missing everybody in South and Central Scotland and North Wales. The number is displayed without an asterisk. I decided the map should show what it knows rather than dress up a gap, and this is where that decision has a visible cost: a total that’s quietly wrong in one direction, for a reason that isn’t the map’s fault and isn’t visible on the map either.
Then there are the six links. Every incident links out to the operator that reported it — their own map, their own fault list, their own page. That’s deliberate and it’s the closest thing this project has to a statement of position: the map isn’t claiming to be the source. It’s claiming to be a faster route to the six sources.
Who it’s for
Now the purpose, which is short.
It’s for the person on the call — the one who’s currently four tabs deep with someone on hold, trying to work out whose wire it is. The map doesn’t make that judgement for them. What it does is collapse the finding part: one screen, six patches, the incident already there with a reference number and an area. The thinking they were doing about which website to trust becomes thinking about what to tell the customer.
And it’s for the person at the other end, who doesn’t care about any of that and just wants to know whether the street’s out, how many houses it is, and roughly when. For them the honest version matters more than a fast one: an estimate that says estimate, a marker that says approximate when it’s approximate, and no pretending that a feed from ten minutes ago is happening now.
That’s the whole thing. Four websites on every call became one screen, and the screen doesn’t do the job — it does the part of the job that was eating the job.
One line on terms
It’s public, it’s at pcut.jabi.uk, and I’m not going to make a claim in either direction about whether pulling six companies’ feeds like this is inside or outside what their operators allow. Go and read the terms for whichever of them you’re curious about; they’re published, and they’re the only authority on the question.
What it isn’t
Not official, not exhaustive, not current to the second, and not the place I’d want anyone making a decision from without checking. It’s missing Northern Ireland entirely, it’s missing a chunk of the customer numbers, and it’s ten minutes behind by design.
It is, however, one screen instead of four websites, and it’s been that for as long as it’s been up.
Chapter 8: ☕ What You Borrow and What It Costs
Everything in this post is borrowed.
Six companies’ live feeds. A French open-data platform I’ve never logged into. Leaflet, written by people I’ve never met. A postcode table generated out of a Royal Mail dump by a script I didn’t write. Postgres, Docker, Next.js, and an AI I argued the parsers through with.
The genuinely mine list is short: six parsers, one list of six words, a cron entry, and a stubbornness problem.
Borrowing’s how anything gets built and I’m not about to get precious about it. But borrowing has a price. This chapter is the bill.
Nobody has to keep still for you
The first cost of borrowing from six companies is that none of them has agreed to stay where they are.
There’s no changelog. No status page aimed at me. No version number on any of these feeds, no deprecation notice, no support address with an obligation to reply. If UK Power Networks renames nocustomeraffected tomorrow, nothing on earth tells me — and given what Chapter 4 says about the naming habits in play, I wouldn’t even be surprised. The first I’d know is a column of zeros where the customer counts used to be.
The best warning available is the operator’s own website working while mine doesn’t. Which is a fine signal if you happen to notice it, and noticing it is the job.
And it isn’t a problem I can solve. The fix would be a shared standard across the six, and Chapter 3 covered why that doesn’t exist: the licensing created six monopolies and nobody sat above them. So every parser in this project is a bet on other people’s habits holding. Those || chains aren’t defensive code written in advance. They’re scars — each one a day something moved without telling me — and the set only grows.
Four of six, by luck
The second cost should bother me more than it does.
The reason this was cheap is that four of the six independently landed on Opendatasoft. Not because anyone standardised anything. Four separate decisions in four separate companies arrived at the same French product, which happens to serve the same URL pattern, the same key-in-a-header, the same pagination, the same where clause.
That isn’t a standard. It’s a coincidence with a good API.
So the most valuable fact in the project is also the least durable one. A contract ends, a platform gets swapped, a new director turns up with a preferred vendor, and the advantage doesn’t fade — it stops. And it won’t fail gently. It won’t drift towards slightly worse data. It’ll hand back a login page or a 404, the parser will get an object where it expected a list, and what appears on the map is nothing.
The two bespoke endpoints are worse placed, and Chapter 4 drew that line already: four are offered, two are observed. Offered means somebody published it on purpose, for you, with a page you can read. Observed means I’m watching what their own website asks for — so the day their website changes, I change too, with no notice and no standing to ask for any.
Four by luck, two by watching, and the whole map resting on both holding.
The borrowing that’s already inside my own code
Then there’s the borrowing closer to home, which is funnier.
The list that decides when a power cut is over is typed out six times instead of being defined once. One of those copies has already drifted down to two words. It happens to be the copy in a function nothing calls, which is luck doing the work a constant should be doing.
The thing that closes finished incidents doesn’t observe anybody finishing. It notices an incident is missing from the current scrape and marks it restored — absence read as completion. If a feed drops a record because somebody renamed a field, I will announce to the world that the power cut has been fixed.
There’s a config block carrying cron entries for weather and transport that nothing schedules. An .env.example with six slots for API keys that nothing reads. A table in the map component saying which licence areas belong to which company — with Southern England filed under the wrong one — and no reference to it anywhere. A postcode geocoder, written properly with timeouts and error handling, that no import has ever touched.
And the front-end’s package description still reads “Backed by an n8n unified incidents feed”, which is a sentence about a version of this map that doesn’t exist any more.
None of it is doing any harm. All of it is an accurate picture of how this got built: over the top of itself, in layers, with the earlier layers left where they fell.
The bill I didn’t expect
Chapter 2 promised I’d explain why I changed my mind about the way the weather and transport maps were built. This is why, and it’s the only genuinely expensive thing in the post.
They were built on n8n. A visual workflow tool that does the fetching and hands the JSON to whoever wants it. It ran the power cut map too — the first version of this map was a 377-line server that did nothing except fetch from an n8n webhook and reshape what came back. Transport goes through it. Weather goes through it; four routes in the weather app point at N8N_BASE_URL/webhook/v1/.... One tool, everything passing through the middle of it, and I’d have told you that was the architecture.
Then it moved behind a paywall, and what moved behind it wasn’t data. Fetching still worked. Transforming still worked. What I couldn’t have without paying was the ability to decide who was allowed to touch which project — single sign-on, roles, keeping one thing isolated from the next. Permission. The capability that got a price tag on it was the one that says “not you”.
And a thing that other people use, running on a tool where “who’s allowed” is an upgrade, isn’t a thing I’m keeping other people’s use on.
There’s a version of this where I never move. The fetch worked, the transformation worked, and single sign-on is not something I’ve ever wanted on a side project. What stopped me wasn’t the missing feature. It was the position it sat in — something I’d put at the centre of three dashboards, that other people were starting to open, held by a licence that can be renegotiated at any moment by people who have never heard of me. Paywalled capability is a price. A paywalled centre is a hostage.
So it went — the power cut fetch, anyway. Out of n8n and into one Express process with Postgres behind it and a cron entry, which is what Chapters 5, 6 and 7 have been describing. Identity is handled by PocketID now, and that’s the whole mention it gets.
Transport and weather didn’t come with it. They’re still pointing at N8N_BASE_URL, still sitting behind the tool I’d just decided I was done with, which is most of the reason Chapter 2 wasn’t counting them. The gateway’s config has their slots waiting — every thirty minutes, every five minutes — with no scraper behind either one. One dashboard made it out. Two are still in. The destination’s built and empty.
And the old arrangement did it worse, which took some of the sting out. It worked out which company served a postcode by pattern-matching the first two letters, which is how a file that ought to know better files BT — Northern Ireland — under a Yorkshire company and takes a swath of North Wales with it. Incidents on the map are now labelled by whichever company reported them, because the feed says who’s reporting. The postcode-guessing is still in there — it works out an operator for your search and then nothing reads it — which I’ll take as progress rather than tidiness.
The price wasn’t money, in the end. It was finding out that what I’d been calling my architecture was somebody else’s pricing decision wearing a costume. Every hour of the rewrite was the bill for borrowing the middle of the system rather than the edges.
That’s the distinction I’d keep out of all this, and it’s the only advice here with any weight to it. Borrow the edges — the library, the format, the platform under four of six feeds — and keep the middle yours. I borrowed the middle, and got it back with an invoice.
What’s mine
Six parsers, one list of six words, a cron entry, a database, a map, and the arrangement between them. That’s the inventory.
If you’re building something like it: read the limits before you write the code, put something in front of the six of them so that nobody’s curiosity can turn into a request, and assume the data will change shape on a day nobody tells you about. The rest is naming.
There’s one more thing on the list that I don’t own, which is the reason. That arrived on a call in Chapter 1 and hasn’t moved since: four websites, someone on hold, and a question with a simple answer that takes a minute to prove. I don’t know whether this ever gets opened on a call, and I’m not telling you either way if it does. What I can say is what it would hand that person — one screen instead of four, six patches with the answer already sitting on them, and an estimate that still labels itself an estimate.
That’s the test I’d hold anything like this against, and it isn’t whether it’s clever. It’s whether the person at the other end gets a truer answer faster than they’d have got a wrong one slowly.
None of this was owed to me — not the data, not the platform, not a warning when something shifts. Six companies, one map, and every part of it borrowed from somebody who didn’t know I existed.
The map’s at pcut.jabi.uk. It’s ten minutes behind and it always will be, and that’s the most honest thing about it.